The Adaptive Learning and Teaching Services team have been assisting a talented and inquisitive research group within the BJBS Psychology department whose primary need was to understand engagement with their online content.
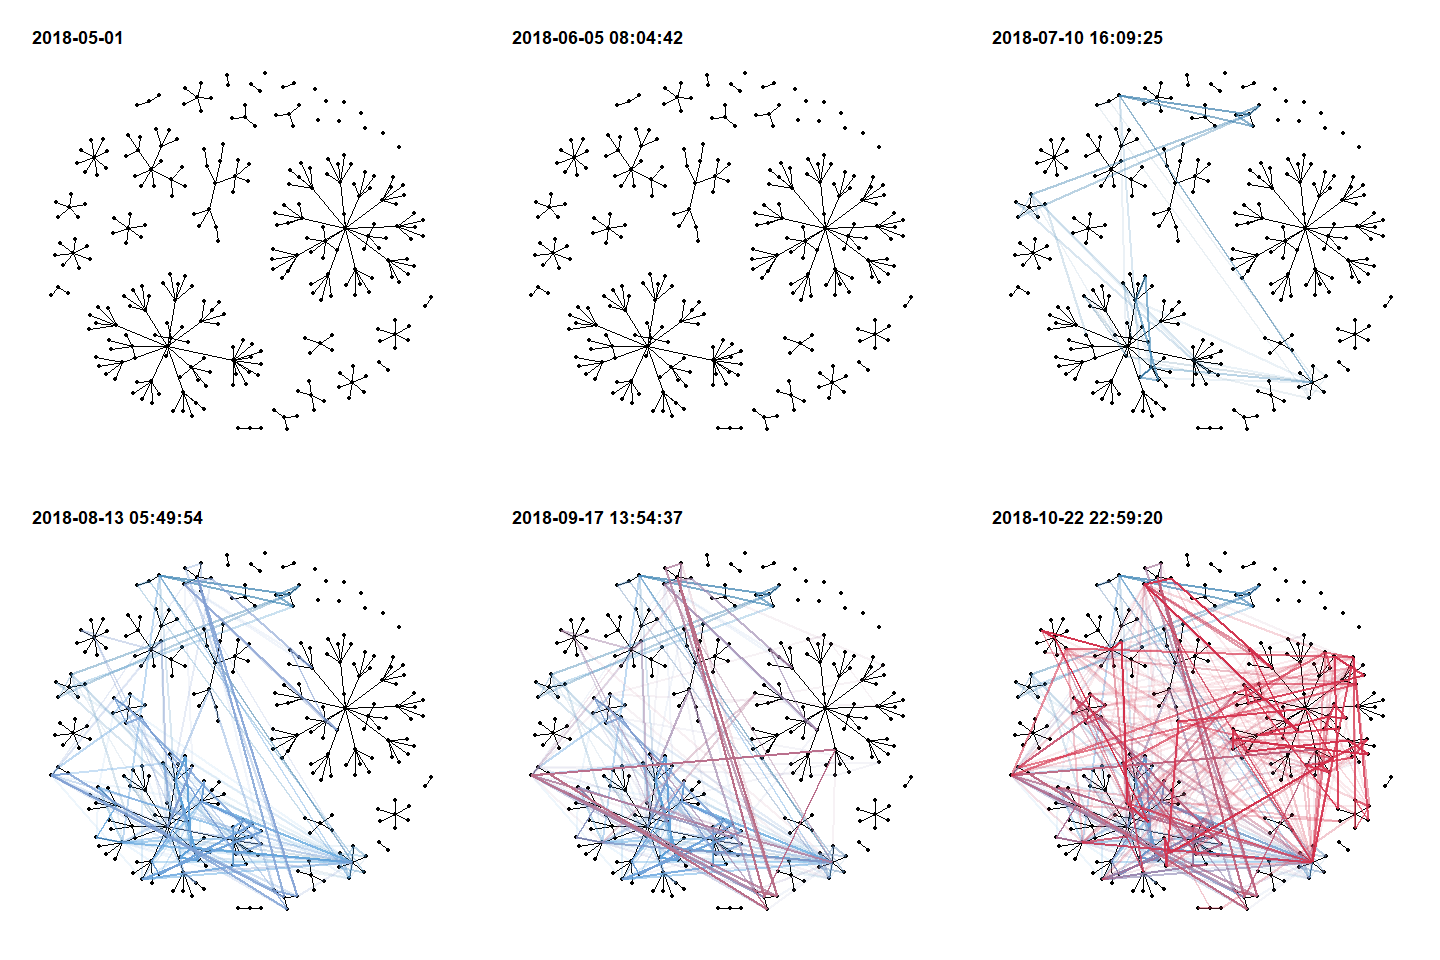
The process of how to best visualise the dense collection of Blackboard Learn activity data has involved much refinement over the course of this year, the challenge being to see how the subject site is structured along with how the student navigates that space throughout time. This animation is the best attempt so far; showing the subject structure in the underlying network of black lines, and a student navigating the site in blue to red lines (red being towards the end of the course).

Contributed by Ben Hicks, Adaptive Learning and Teaching Services, Learning Technologies Unit, Division of Learning and Teaching
